Adam Hibberd
November 2022
In my last blog I reported the progress of my work regarding the intriguing little conundrum of the first interstellar object (ISO) to be discovered, designated ‘Oumuamua, in particular my research into its orbit.
In fact ‘Oumuamua is puzzling on many counts and I have also in a previous blog elaborated on its curious characteristics - including its shape, its brightness, the presence of a force as it encountered the inner solar system, etc. I also remarked on its direction of origin, otherwise known as its incoming radiant, which was from approximately the direction of the Solar Apex.
The Solar Apex is the direction the solar system is travelling relative to other stars in its neighbourhood. If you think about it, if you were to drive through a plague of locusts, you’d expect most would strike on your front windscreen, in other words in your direction of travel, and many fewer on the sides or rear – the same logic applies to ISOs encountering the solar system and in particular ‘Oumuamua.
I have already defined the six orbital parameters which I have been using for this research, and they are given, together with their values for ‘Oumuamua in Table 1.
Table 1 Orbital Parameters Used and the Values Adopted by 'Oumuamua
| Parameter | Definition | Value for ’Oumuamua |
| Tperi | Time of Perihelion | 2017 Sep 09 UTC |
| b | Impact Parameter | 0.85 au |
| β | β angle | 171.2 ° |
| λ | Ecliptic Longitude of Incoming Radiant | 284.4 ° |
| ϕ | Ecliptic Latitude of Incoming Radiant | 56.8 ° |
| V∞ | Hyperbolic Excess Speed | 26.4 kms−1 |
In my previous blog I decided to vary only the parameter Tperi, in other words the time of perihelion of ‘Oumuamua, in order to test exactly how this might affect ‘Oumuamua’s closest approach to Earth (perigee) and furthermore the Sun-Earth-1I angle at perigee (the angle subtended at Earth between the Sun and 1I/’Oumuamua). We found that in fact for ‘Oumuamua, its true value of Tperi was such as to yield extreme values of these two parameters which effectively increased markedly its chance of observation by Earth telescopes. The relevant plot is provided again, see Figure 1 below.

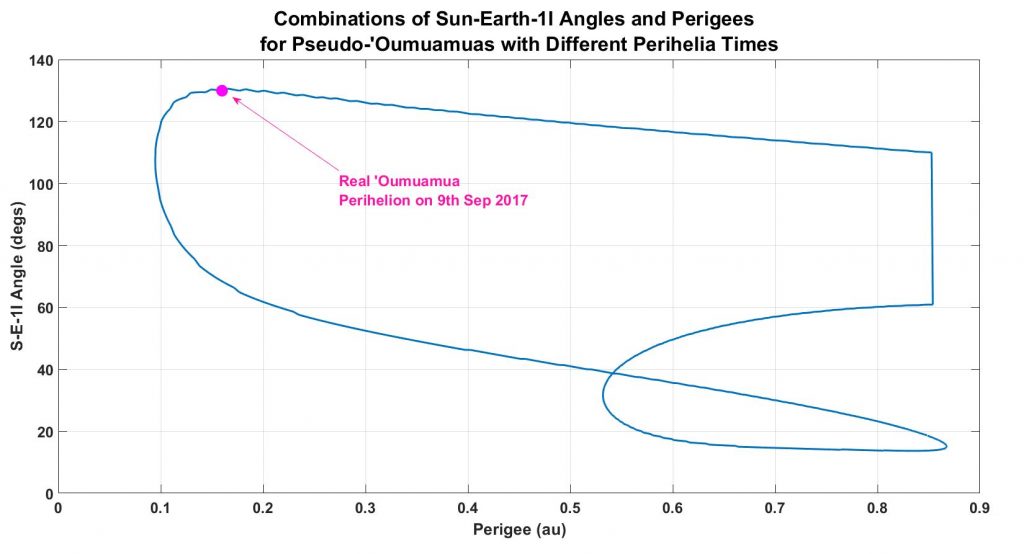
For further effect, I since decided to plot the two pertinent parameters, S-E-1I angle against perigee distance on a separate graph, and this is shown in Figure 2. Observe that ‘Oumuamua’s timeline, as adjusted using mods to the perihelion date, resulted in the maximum possible S-E-1I angle at ‘Oumuamua’s true perihelion date and in addition, almost the lowest possible perigee.
But let us instead analyse this from a different perspective. Let’s say we already know that (a) the perigee distance is particularly small and (b) the S-E-1I angle is particularly large (respectively) for ‘Oumuamua. It follows therefore if we were to single out ANY particular parameter, X, from Table 1 and vary it whilst keeping the remainder fixed, we would attain the same results as we saw when we adjusted time of perihelion only, i.e. extremes of perigee and S-E-1I angle at the particular value of X which ‘Oumuamua adopted. I now come to the essence of this blog.
What we shall do is try LOTS and LOTS of different combinations of the parameters Tperi, b and β-angle, and investigate their effect on the two aforementioned characteristics, (a) & (b), always keeping the remaining three parameters, λ, ϕ & V∞ fixed.
But why undertake such an analysis? The reasoning is as follows.
Let’s say ‘Oumuamua were able to change its velocity in some way as it approached our inner solar system, then we might inquire which aspects of its orbit could it easily change, and which would be more difficult?
It so happens that λ, ϕ & V∞, are all pretty much set in stone because, as has been already discussed above, they are largely a consequence of the solar system’s dynamics through interstellar space. However the specific values of Tperi, b and β-angle, would be extremely easy to control, particularly at large distances from the sun, and so a hypothetical intelligent ‘Oumuamua could select values of these which might reasonably optimise some criterion, or criteria as we have already seen in the research elaborated above.
So I conducted just such an investigation and put together the 3D scatter plot, Figure 3. To generate the data for this 3D plot, I supposed a 3D grid of Tperi, β and b - with 40 values of each parameter making a total of 64,000 combinations. Thus there are:
- 40 values of Tperi , 20 either side of ‘Oumuamua’s true Tperi
- 40 values of β, between 0° and 360°
- 40 values of b, between 0.1 au and 2.0 au.
The red dots are combinations of the 3 above parameters where (a) perigee was less than 0.17 au and (b) S-E-1I angle was greater than 125°.
Leaving aside the interesting patterns in these red dots (which is beyond the remit of this article): there are clearly other combinations of these 3 parameters which yield the peculiar properties which 'Oumuamua had.
If one sums all the red dots and divides by 64,000 one can estimate the likelihood of both (a) and (b) holding true for a random ‘Oumuamua. We get 0.25%. Assuming randomly and uniformly distributed values of Tperi, β and b, this corresponds to 5 in every 2000 putative ‘Oumuamuas showing this behaviour.
At this point I shall bring this blog to an end and in my next I shall summarise the conclusions which can be drawn. In the meanwhile, I shall let you contemplate the findings and draw your own conclusions in your own time.
